
OpenJDK Platform Binary: What It Is and Which App Is Running It
OpenJDK Platform Binary is just Java running someone else's program. Here is how to find out which application started it, why it burns CPU, and how to tell a legitimate Java process from one worth investigating.
OpenJDK Platform Binary is Java running something. It isn’t an app in its own right, it isn’t spyware, and it isn’t a Java installation that’s gone wrong. It’s the name Windows shows for java.exe or javaw.exe — the Java runtime — when some program on your PC is written in Java and currently executing.
Which is a deeply unhelpful thing for Task Manager to tell you, because it names the engine instead of the car. Minecraft, IntelliJ IDEA, Android Studio, Ghidra, JMeter, a Logitech or Wacom background service, your company’s VPN client, a Jenkins agent, an old Oracle installer that never finished — all of them show up under that same label, and often several at once.
So the useful question is never “what is OpenJDK Platform Binary”. It’s which application is this one? That’s the question almost every page on this topic skips, and it’s the one this guide answers first — in about ninety seconds, with a command that prints the answer directly.
After that: why it burns CPU (the real causes, not “update your graphics drivers”), why it reserves far more RAM than it’s using, how to tell a legitimate Java process from something wearing its name, and when ending the task is safe.
Where the name comes from
Windows doesn’t invent that label. Every Windows executable carries a metadata field called File description, and Task Manager shows it instead of the filename. Open the properties of java.exe from an OpenJDK-derived build and that field reads “OpenJDK Platform Binary”.
That gives you a free piece of information most people miss — the label tells you whose Java build it is:
| What Task Manager shows | Which Java build it is |
|---|---|
| OpenJDK Platform Binary | An OpenJDK build — Eclipse Temurin, Amazon Corretto, Azul Zulu, Microsoft Build of OpenJDK, or a runtime bundled inside an app |
| Java(TM) Platform SE binary | Oracle’s own JDK or JRE |
| Java Platform SE binary | An older Oracle JRE, typically Java 8 |
There are two executables behind it and the difference matters when you’re hunting:
java.exe— opens a console window. Used by command-line tools, build scripts and servers.javaw.exe— identical, minus the console. Used by anything with a graphical interface, which is why Minecraft and most desktop Java apps run asjavaw.exe.
If a Java process appears with no window anywhere on screen, it’s almost certainly javaw.exe, and it was probably started by something else rather than by you.
Find out which application it actually is
Every process on Windows remembers the exact command that launched it. For Java that command is unusually informative, because it contains the JAR file or the main class. Read it and you have your answer.
The fastest way: Task Manager’s hidden column
- Press Ctrl + Shift + Esc to open Task Manager.
- Go to the Details tab. Not Processes — Details.
- Right-click any column header and choose Select columns.
- Tick Command line, and while you’re there tick Image path name too. Click OK.
- Find
java.exeorjavaw.exeand read across.
That column is off by default, which is the single reason this question gets asked as often as it does. Turn it on once and it stays on.
The better way: one line of PowerShell
The Task Manager column truncates long command lines, and Java command lines are long. PowerShell gives you the whole thing:
Get-CimInstance Win32_Process -Filter "Name='java.exe' OR Name='javaw.exe'" |
  Select-Object ProcessId, CommandLine | Format-List
You’ll see plenty of older pages recommend wmic process get commandline. That still works on some machines, but WMIC is deprecated and Microsoft has been removing it from Windows — if it returns “not recognized”, that’s why. The command above is the supported replacement and does the same job.
The precise way: ask Java itself
If you have a JDK installed (not just a runtime), it ships with tools built for exactly this:
jcmd -lThat prints every running JVM on the machine with its process ID and main class or JAR. jps -lvm does much the same and adds the JVM arguments. Both live in the JDK’s bin folder, so if the command isn’t found, either you only have a runtime installed or that folder isn’t on your PATH.
Reading what comes back
A Java command line looks intimidating and is actually simple once you know where to look. Here’s a real-shaped one, wrapped for readability:
"C:Program FilesEclipse Adoptiumjdk-21.0.5.11-hotspotbinjavaw.exe"
  -Xmx4G -XX:+UseG1GC
  -jar "C:UserssamAppDataRoaming.minecraftlauncher.jar"
Three parts carry all the meaning:
- The path to the executable tells you which Java build, and its version —
jdk-21.0.5.11above. - Arguments starting with
-Xor-XX:are JVM settings.-Xmx4Gmeans “you may use up to 4 GB of heap”. Remember that one; it explains the memory section below. - Everything after
-jar, or the last plain class-looking name is the application. That’s your answer. Here it’s the Minecraft launcher.
If what follows -jar is a path inside a program’s own folder — C:Program FilesJetBrains..., ...Wacom..., ....minecraft... — you’ve identified the culprit and can stop. Nine times out of ten it’s something you installed deliberately and forgot runs on Java.
Why it’s using so much CPU
Search this topic and you’ll be told to update your graphics drivers. For a process that is, by definition, running someone else’s program, that advice is close to meaningless. The Java runtime doesn’t consume CPU on its own — it consumes CPU because the application inside it asked for work.
The shape of the usage tells you a lot:
| What you see | Most likely cause | Where to look |
|---|---|---|
| Heavy for 10–60 seconds after launch, then settles | Normal. Class loading and JIT compilation. | Nothing to fix. |
| One core pinned at 100%, indefinitely | An infinite loop or a stuck thread in the app. | Thread dump — see below. |
| All cores busy, memory near its ceiling, sawtooth pattern | Garbage collection thrashing. The heap is too small for the workload. | Raise -Xmx. |
| Regular spikes on a clock — hourly, every 15 minutes | A scheduled job inside the app. | The app’s scheduler config. |
| Busy with the app closed | A background service, an updater, or a process that failed to exit. | Command line will name it. |
| Busy the moment Windows starts | Something in your startup items. | Task Manager → Startup apps. |
That fourth row deserves a note. If usage climbs on a predictable timetable, you’re almost certainly looking at a scheduled task inside the application — Quartz, a Spring @Scheduled annotation, or a plain cron entry. Those schedules are written as cron expressions, and the difference between a job that runs once an hour and one that runs every minute of one hour is a single character. If you find such an expression in a config file and want to know what it actually means before you change it, our Cron Expression Generator will translate it into plain English and show you the next several run times.
Finding the stuck thread
When one core is pinned, you can see precisely where the program is stuck. Get the process ID from Task Manager’s Details tab, then:
jcmd <pid> Thread.print > threads.txtThat writes a snapshot of every thread and what each is executing. Take two or three, thirty seconds apart. A thread that appears at the same place in all of them is your problem, and its name usually says which feature it belongs to. You don’t need to understand the stack trace to file a useful bug report — you just need to attach it.
Java’s own logs help here too, though there’s a trap. Timestamps in JVM logs and in most Java applications are Unix epoch values in milliseconds, not seconds, because that’s what System.currentTimeMillis() returns. Paste a thirteen-digit number into a converter expecting ten digits and you’ll get a date in 1970. Our Epoch & Unix Timestamp Converter detects which unit you’ve given it before converting, and there’s more on that particular trap in why your Unix timestamp is 1000 times off.
Why it’s holding so much RAM
This is the second complaint, and most of the time nothing is wrong.
The JVM doesn’t ask the operating system for memory each time the program needs some. It reserves a large region up front — the heap — and manages allocation inside it. Windows reports the reserved region. So a Java process can show 2 GB in Task Manager while the program inside is genuinely using 300 MB.
Two numbers control it:
-Xms— the starting heap size.-Xmx— the maximum. This is the number that matters.
If neither is set, modern JVMs default the maximum to one quarter of your physical RAM. On a 32 GB machine that’s an 8 GB ceiling for a program that may never need 500 MB. It won’t necessarily take it, but the ceiling explains the alarming figures people report.
Lowering -Xmx caps the memory. It does not make the program lighter — it makes garbage collection run more often, and if you set it below what the app genuinely needs you’ll trade a memory complaint for a CPU complaint, or an OutOfMemoryError. Most desktop apps expose this in their own settings (Minecraft’s launcher has a slider; JetBrains IDEs have Help → Change Memory Settings). Change it there rather than editing anything by hand.
Is it malware?
Usually not. But “it’s a normal Windows process” is a lazy answer, because java.exe is a general-purpose program runner and there is real Java-based malware — remote access tools like STRRAT and Adwind have been distributed as JAR files for years. The process name proves nothing on its own. What you check is where it lives and what it’s running.
Normal locations look like:
C:Program FilesEclipse Adoptium...C:Program FilesJava...C:Program FilesAmazon Corretto...,...Zulu...,...Microsoftjdk-...- Inside an application’s own folder — JetBrains IDEs, Minecraft’s
runtimedirectory, and many others bundle their own Java
Treat these as worth a second look:
- Anything under
%TEMP%or%APPDATA%Roamingwith a random-looking folder name - A
-jarargument pointing at your Downloads folder, or at a JAR with a name you don’t recognise java.exesitting loose inC:WindowsorC:WindowsSystem32— Java is never installed there
None of those is proof of anything. Plenty of legitimate installers stage files in temp folders. They’re a reason to read the full command line and identify the JAR, not a reason to panic.
Verifying a Java install you downloaded yourself
If you’re about to install a JDK — or you’re suspicious of one already on the machine — check the file against the checksum its publisher published. Eclipse Adoptium lists a SHA-256 next to every download, and the other major vendors do the same.
Compute the hash of your copy and compare the two strings. They match exactly or they don’t; there’s no partial credit. You can do it locally with our Hash Generator, which reads the file in your browser and never uploads it — worth knowing when the file you’re checking is one you already don’t trust. Windows has a built-in equivalent if you’d rather use the terminal:
Get-FileHash .OpenJDK21U-jdk_x64_windows_hotspot.msi -Algorithm SHA256A mismatch means the file was altered or the download was corrupted. Either way, delete it and fetch it again from the vendor’s own site.
Which version you’re on, and whether it matters
The path in the command line usually contains the version. Or ask directly:
java -versionJava’s numbering trips people up because it changed. Modern releases read 21.0.5 — feature release, interim, update. Older ones read 1.8.0_401, where the “1.” is a historical artefact and the real version is the 8.
A number like 11.0.21 is Java 11, update 21. Java 11 was an LTS release from 2018 and is now well past its useful life for anything exposed to the internet.
| Version | Released | Status |
|---|---|---|
| Java 25 | September 2025 | Current LTS |
| Java 21 | September 2023 | Previous LTS, widely deployed |
| Java 17 | September 2021 | Older LTS, still common |
| Java 11 | September 2018 | Legacy |
| Java 8 | March 2014 | Very old, still everywhere |
Here’s the part that matters practically: upgrading Java is usually not your decision. An application that bundles its own runtime uses that runtime regardless of what else is installed, and replacing it can break the app outright. If a Java process on your machine is old, the fix is to update the application and let it bring its runtime with it. whichjdk.com is a genuinely good, vendor-neutral reference if you’re choosing a JDK for your own development work.
Several versions coexisting is normal, not a problem to clean up. Three IDEs and a game can easily mean four runtimes.
Ending the process safely
You can end it. Whether you should depends entirely on what it’s running — which is why identification comes first.
- Safe: a game or an editor you’ve already closed and which didn’t exit cleanly.
- Risky: anything mid-write — a build, a database, an app with unsaved work. Java gets no chance to flush buffers when you force-kill it. Corrupted world saves and half-written project files come from exactly this.
- Pointless: a Windows service or an app with a watchdog. It restarts within seconds and you learn nothing.
Always try closing the application properly first. If you must kill it:
taskkill /PID <pid> /FIf it keeps coming back, it’s being started by something. Check Task Manager’s Startup apps tab, then Services, then Task Scheduler. Ending a process is treating the symptom; finding its parent is treating the cause.
Five mistakes worth avoiding
- Uninstalling Java to make it stop. This breaks every Java application on the machine and doesn’t touch apps with a bundled runtime — the most common source of the process in the first place.
- Updating graphics drivers. Recommended constantly on this topic. It’s unrelated unless the Java app is a game doing heavy rendering, and even then it’s a distant second to identifying the app.
- Setting
-Xmxas low as it will go. Caps memory and creates a CPU problem. The JVM will spend its time collecting garbage instead of working. - Assuming one Java process means one Java app. IDEs routinely spawn several — the editor, a Gradle daemon, a language server, the program you’re debugging. Read each command line separately.
- Trusting the name in either direction. “OpenJDK Platform Binary” is not a clean bill of health, and it isn’t cause for alarm either. It’s a label on a runtime. The path and the JAR are the evidence.
Common questions
Can I remove OpenJDK Platform Binary?
There’s nothing to remove — it’s the display name of the Java runtime, not an installed product. You can uninstall a JDK from Apps & features, but that only removes standalone installs, and anything with a bundled runtime keeps working. Removing the application that starts it is the real fix.
Why is it running when I’m not using any Java program?
Because something started it in the background — a launcher, an updater, a service, a scheduled task, or an app that didn’t exit properly when you closed its window. The command line will name it.
Is OpenJDK Platform Binary the same as Minecraft?
No, but Minecraft is the most common reason people see it. Minecraft Java Edition runs on the JVM, so the launcher and the game both appear under that label. Modpacks make it more noticeable — mods raise both CPU and memory demand considerably.
Why does it use 100% CPU with nothing open?
Most often a background process still running after its window closed, or a scheduled job firing. Identify it with the command line first. If the process outlives the app every time, that’s a bug worth reporting to the app’s developers, and a thread dump will make the report actionable.
Is it a virus?
Almost always no. Check where the executable lives and which JAR it’s running. A runtime under Program Files or inside an application’s own folder, running a JAR that belongs to that application, is normal. A JAR you don’t recognise running out of a temp folder deserves a proper scan.
How much memory should it use?
There’s no single right answer — it depends on the application and its -Xmx setting. A large reserved figure is not itself a problem. Worry when memory sits at the ceiling and CPU is high, which together mean the heap is too small.
Will updating Java fix high CPU?
Rarely. The CPU is being used by the application, not the runtime. Newer runtimes bring better garbage collectors and can help at the margins, but if one app is pinning a core, updating Java underneath it changes very little. Update the app instead.
Tools in this guide
Hash Generator
MD5, SHA-1 and SHA-2 digests, plus checksum verify.
Cron Expression Generator
Build or decode a cron expression and see its next 10 run times.
Epoch & Unix Timestamp Converter
Unix timestamps to dates and back, in any unit.
All of them run in your browser. Nothing uploaded.
More guides
Developer Tools
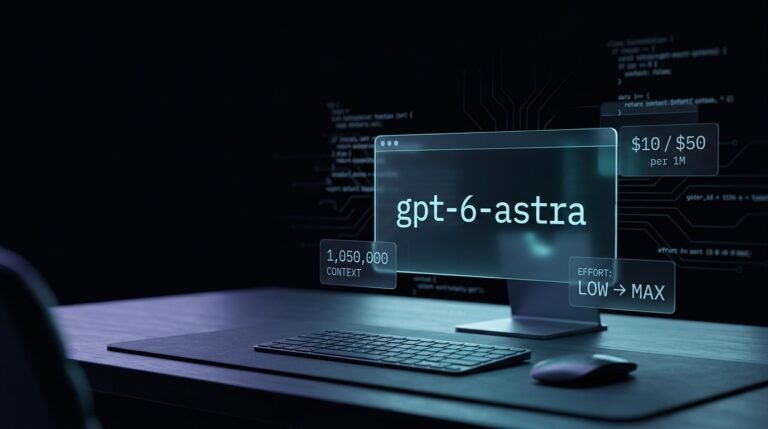
GPT-6 Astra for Developers: API, Pricing and Benchmarks
GPT-6 Astra has a 1.05M context window and costs $10/$50 per million tokens. It also breaks your integration in four specific ways, and loses to Claude on three coding benchmarks at the same price. What the release notes do not tell you.
Developer Tools
What Is Actually Inside a JWT
A JWT is three chunks of Base64, and the first two are readable by anyone holding the token. What the signature protects, what the claims mean, and why alg:none was a real vulnerability.
Tool: JWT Decoder
Converters & Units
How to Convert YouTube to MP3 Legally
The routes YouTube allows: your own uploads from YouTube Studio, the Audio Library, and permission from the creator. Then convert the file to MP3 without uploading it.
Tool: YouTube to MP3 Converter
Last updated: September 4, 2026